Potable Water Reuse Report
Published by the University of Southern California ReWater Center in collaboration with Trussell
Series 3, Issue 2
10 August 2026
TOC as a Surrogate for Chemical Control in Potable Reuse
Key Takeaways:
- TOC monitoring is a chemical control strategy used to (1) protect consumers from known and unknown organics including potentially toxic compounds, (2) minimize DBP formation, and (3) track process performance.
- TOC has many properties of an ideal surrogate because it can be monitored: (1) in real-time and at high-frequency, (2) with sensitivity and accuracy across wide concentration ranges, and (3) by reliable commercial technologies.
- TOC limits for purified waters vary across the world depending on treatment requirements, end-use, source water quality, and complementary control strategies.
- TOC concentrations do not always correlate with toxicity.
- TOC limits should be paired with targeted and non-targeted monitoring (mass spectrometry and/or bioassays) to assess the health risks posed by toxic organics and disinfection byproducts.
Introduction
The first issue in this series on chemical control in potable reuse started with two guiding questions: (1) how do we decide which of the millions of chemicals to focus on, and (2) what strategies can we employ to control them in potable reuse? One of the strategies for chemical control is monitoring of total organic carbon (TOC). But is TOC a good indicator of toxic compounds? What is the right limit for TOC?
A survey of potable reuse regulations across the U.S. reveals a wide range of TOC limits from 0.5 to 4 mg/L or higher. A glass of purified water in Arizona can legally carry four times as much TOC (2 mg/L) as California (0.5 mg/L), while Colorado allows TOC to match the drinking water TOC.
What is driving the difference in TOC limits? Does a lower TOC limit mean greater protection against organic contaminants? This issue of the Potable Water Reuse Report first reviews historical drivers for TOC limits before focusing on how TOC is used in reuse settings today. We reached out to several industry experts (Table 1) to gain insights into the benefits and limits of TOC and the roles it plays in controlling chemical contaminants.
Table 1: Experts interviewed for this issue
|
Interviewee |
Title |
Organization |
|---|---|---|
|
Gary Amy |
Dean’s Distinguished Professor |
Clemson University |
|
Paul Westerhoff |
Regents Professor |
Arizona State University |
|
Larry Schimmoller |
Global Principal for Water Reuse |
Jacobs |
As we think about controlling exposure risk in potable reuse, two key features differentiate chemicals from pathogens: the huge diversity of potential compounds and the chronic nature of their threat. In light of this, two guiding questions for chemical control are: (1) How do we decide which chemicals to care about? (2) How do we ensure our potable reuse systems control these diverse threats? For this issue, we interviewed some of the industry’s experts to gain perspective on these important questions (Table 1).
1) History of TOC monitoring
In the first half of the 20th century, the water industry made great strides in public health protection by focusing on controlling waterborne pathogens. By the time the Safe Drinking Water Act (SDWA) passed in 1974, pathogens were still a key motivator, but the United States Environmental Protection Agency (EPA) also broadened its focus to include toxic chemicals. Surveys showed the presence of organic contaminants in source waters across the country. There was also a growing understanding that disinfecting these waters could produce toxic byproducts. Within a year of passing the SDWA, the EPA set its first limits on six organic chemicals. The nation had entered a new era of drinking water—the chemical era.
Around the same time, California was developing the nation’s first draft regulations for indirect potable reuse (IPR), which included requirements for toxic chemical control. The treatment technology used at the time could reduce TOC to ~3 mg/L. However, California’s health expert panel noted that more than 90% of the remaining TOC was uncharacterized. Due to concerns that some of this uncharacterized TOC may include toxic organics, California adopted an initial TOC limit of 3 mg/L. In 1989, when reverse osmosis (RO) was included in the IPR treatment requirements for groundwater injection, the TOC limit was tightened to 1 mg/L. And later, with the advent of higher-performance, thin-film composite RO membranes, the TOC limit was further tightened to the current limit of 0.5 mg/L.
Expert panels have been candid, however, about the limitations of TOC for chemical control. In particular, they flagged the uncertain relationship between toxicity and bulk organics. As early as 1991, regulators concluded that "TOC is not an appropriate parameter on which to establish a health-based standard," but noted that TOC monitoring was useful for tracking the performance of treatment processes and ensuring they were achieving high levels of organics control. Paul Westerhoff notes, “From a health perspective, I don’t think TOC provides much information. It’s a good operational parameter, but there’s little evidence it’s a good health indicator.”
Turning our attention to the present day, we ask: is TOC monitoring still a useful tool? What is the “right” TOC limit for different projects? How should we complement TOC monitoring with other strategies?
2) Roles for TOC Monitoring in Reuse
In potable reuse, there are multiple drivers to establish TOC limits: (1) to control known and unknown toxic organics, (2) to limit the formation of toxic disinfection byproducts (DBPs), and (3) to assess the performance of treatment trains (Figure 1).
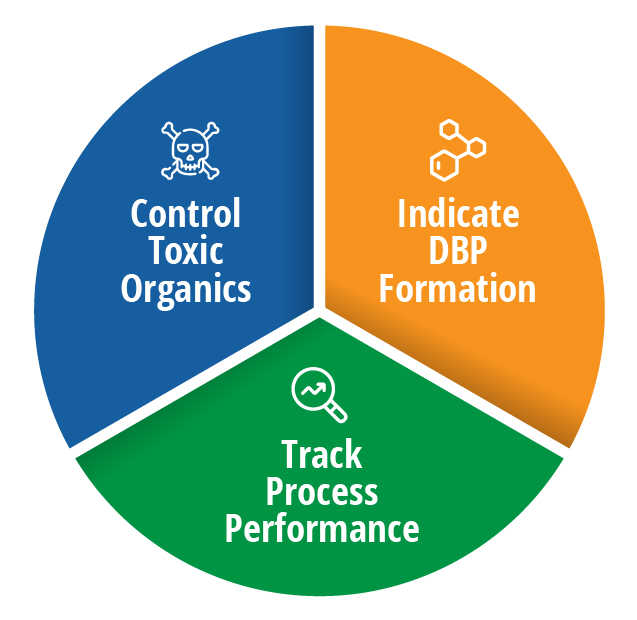
Figure 1: Chemicals are typically a chronic hazard rather than an acute hazard.
Controlling Toxic Organics in Purified Water
TOC is a bulk parameter, but the “less is better” philosophy assumes TOC is still a good indicator of toxic compounds. We know, however, that not all TOC is harmful. “Your morning cup of tea has about 100 mg/L of TOC. It tastes great. Perfectly healthy,” notes Gary Amy, highlighting the importance of understanding the composition of the TOC in water.
Surface waters (with 1-10 mg/L TOC) and groundwaters (with 0.1-2 mg/L TOC) contain TOC that is largely composed of natural organic matter (NOM) (i.e., large, complex organic molecules that are produced in the environment and include a mixture of humic and fulvic acids). While innocuous, NOM is poorly removed through most drinking water treatment processes and, thus the TOC of the finished drinking water is similar to the source water. “We're all drinking TOC,” notes Larry Schimmoller.
The evolving composition of TOC is illustrated in Figure 2. In this Figure, NOM and its components are termed “refractory source water TOC.” The refractory source-water TOC is removed by 15-50% during drinking water treatment. Through human use, a large concentration of anthropogenic organics is introduced into wastewater (100-500 mg/L TOC). Wastewater treatment then reduces TOC to 10-20 mg/L. The TOC remaining in the wastewater effluent contains a small fraction of refractory organics (both anthropogenic and surface-water TOC, usually 1-3 mg/L). Of this remaining TOC, the anthropogenic portion is most likely to contain toxic compounds. Gary Amy describes a key limitation of using TOC to track toxicity: “We are measuring several milligrams per liter of TOC as a surrogate, but all of these organic micropollutants are present at or below micrograms per liter.”
Advanced treatment processes further remove TOC from the treated wastewater. In carbon-based advanced treatment (CBAT) trains, the ozone/biologically activated carbon (BAC) and granular activated carbon (GAC) processes remove a large portion of the biodegradable and refractory organics through a combination of oxidation, biodegradation, and adsorption, achieving effluent concentrations of 3-4 mg/L TOC. In RO-based trains, TOC is removed to even lower levels (<0.5 mg/L). One of the main distinctions between CBAT and RO is that RO treatment trains more effectively remove the refractory source water TOC (NOM), as shown in Figure 2.
Therefore, even though these trains may have very different overall TOC values, they may ultimately have similar levels of toxic organics. This distinction helps explain why regulations can require different TOC limits: higher TOC does not necessarily mean higher toxicity.
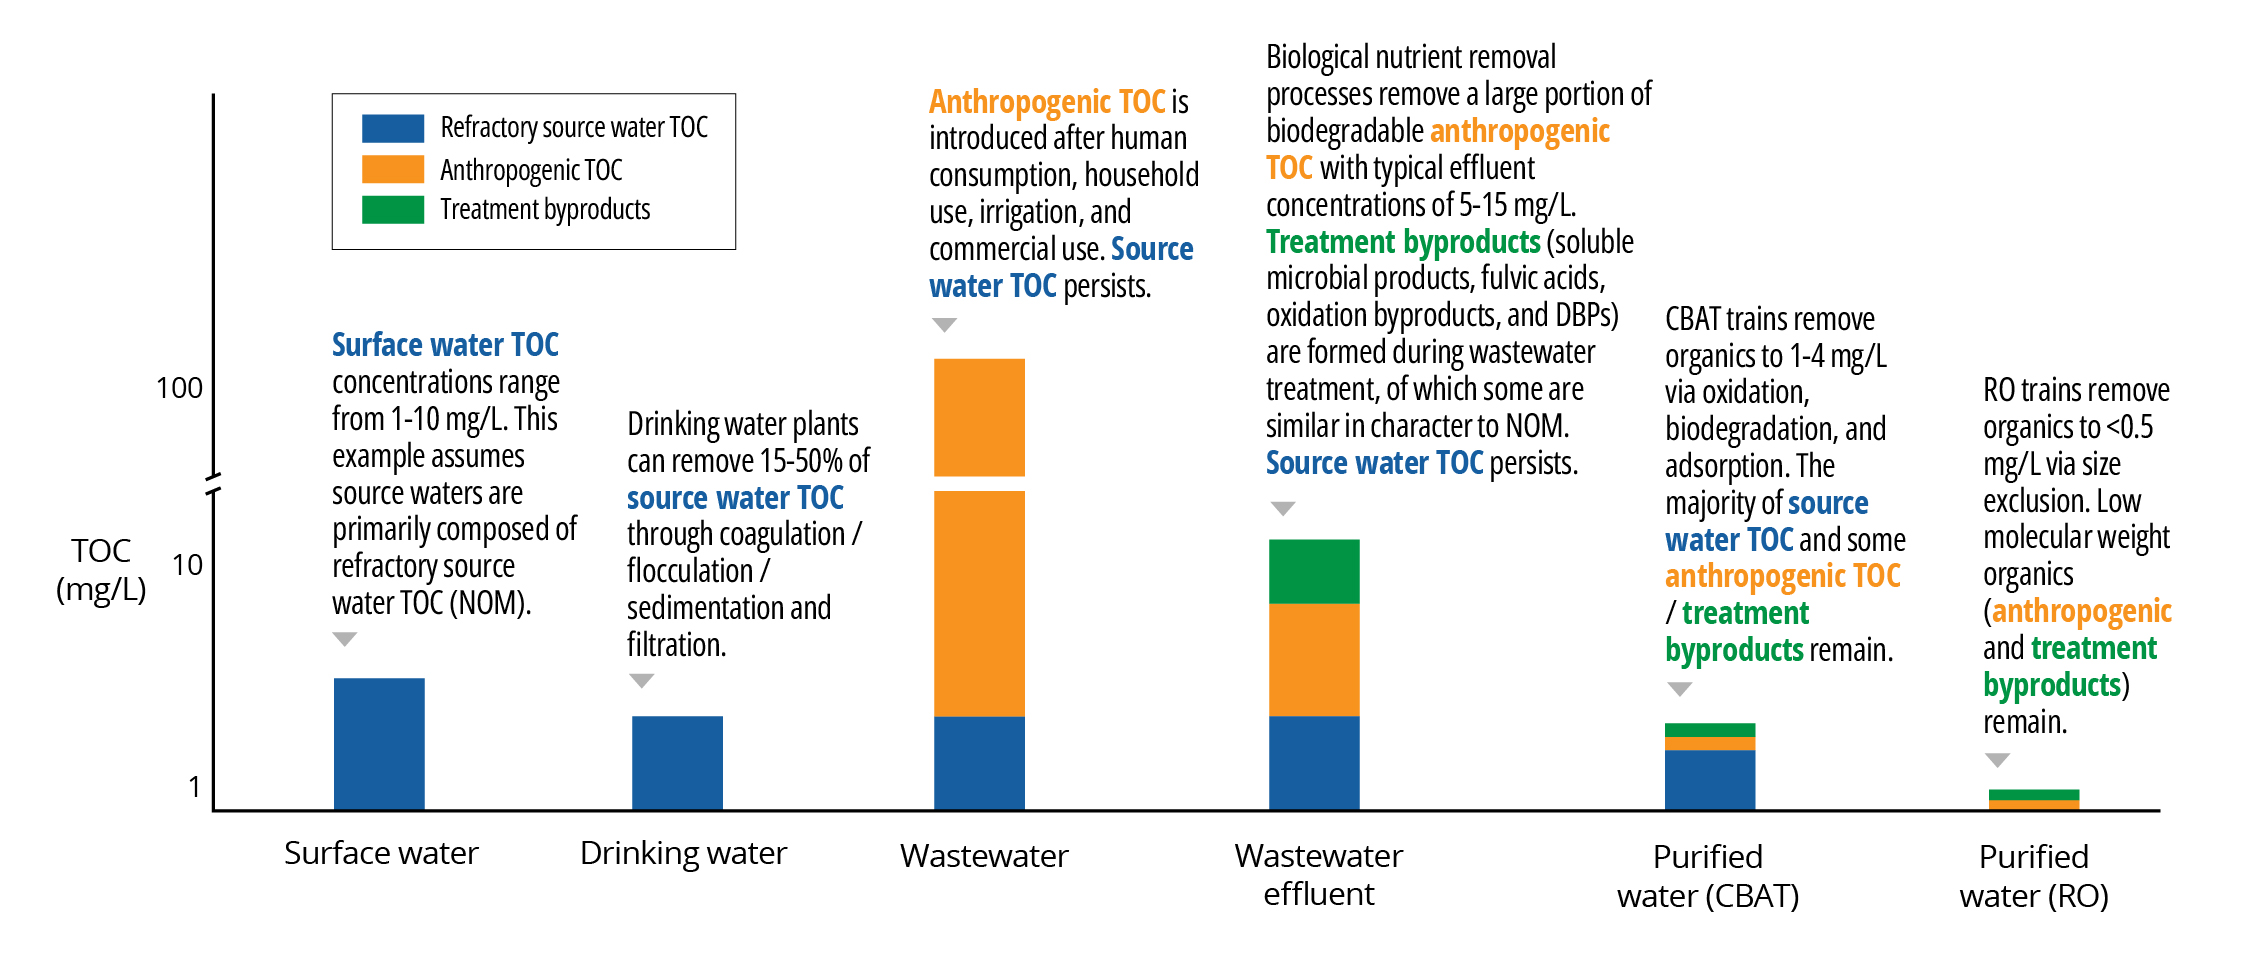
Figure 2: Graphical illustration of how the concentration and composition of TOC change through water treatment and use. Advanced treatment trains may produce different residual TOC concentrations that differ substantially in composition. Thus, TOC concentration alone is not a reliable indicator of toxic organic contaminants.
So how are TOC limits determined? We see that TOC limits vary among different potable reuse schemes (Table 2). The selection of a TOC limit is influenced by multiple factors, including treatment (CBAT vs. RO), end use (IPR or direct potable reuse (DPR)), and source-water TOC composition. A TOC limit of 0.5 mg/L may be sensible in a state like California, where RO treatment is mandated, but less justifiable in other states (e.g., Florida) where RO-based trains are not required. As Gary Amy described, “Florida has all kinds of humic substances in their groundwaters and surface waters. The background dissolved organic carbon would never allow you to have a 0.5 mg/L limit. It just doesn't apply in a place like Florida.” Larry Schimmoller explained Colorado's approach: “When we’re making purified water from wastewater, we should return the TOC down to the levels found in the drinking water.”
Table 2: TOC limits for existing potable reuse schemes
|
Jurisdiction |
End-Use |
TOC Limit (mg/L) |
Basis |
|---|---|---|---|
|
California, USA |
IPR/DPR |
0.5 |
Regulation |
|
Windhoek, NAM |
DPR |
1 |
Internal standard |
|
Arizona, USA |
DPR |
2 or no greater than drinking water |
Regulation |
|
Florida, USA |
IPR/DPR |
3 |
Regulation |
|
Upper Occoquan Service Authority, Virginia, USA |
IPR |
Approx. 3 |
Chemical oxygen demand (COD) limit of 10 mg/L |
|
Gwinnett County, Georgia, USA |
IPR |
Approx. 4 |
COD limit of 18 mg/L |
|
Hampton Roads Sanitation District, Virginia, USA |
IPR |
4 |
Facility-specific regulatory limit |
|
Colorado, USA |
DPR |
No greater than drinking water |
Regulation |
TOC limits encourage projects to maintain consistently low levels of both known and unknown organics in the product water. While known contaminants are typically monitored directly on a monthly or quarterly basis, TOC monitoring provides additional real-time indication of effective organics control. Because it can be monitored continuously, TOC is also an excellent indicator of chemical spikes that may come through treatment trains due to failures in source control or illicit discharges. In fact, California’s DPR regulations require a source investigation if TOC levels are consistently elevated.
Controlling DBP Precursors
While pharmaceuticals, pesticides, and trace organic compounds are often perceived as the principal chemical threats, the compounds that typically pose the highest risk in potable reuse are not present in the wastewater—they are formed as byproducts of treatment. Because DBPs result from the interaction between chemical disinfectants and organic and inorganic precursors, one of the main control strategies is to reduce precursor concentrations in the water. NOM is a well-documented precursor contributing to the formation of halogenated DBPs, including regulated compounds such as haloacetic acids and trihalomethanes. Consequently, EPA’s regulations for controlling DBP formation include requirements for reducing TOC before adding disinfectants.
Monitoring Treatment Process Performance
Several treatment processes that are commonly used in potable reuse trains (e.g., RO, GAC, and BAC) provide chemical control by removing TOC—including toxic organics—from the water. Measuring TOC removal through each process provides an indication of process performance. Monitoring the effluent TOC also confirms that the treatment train has reduced the TOC below regulatory limits.
TOC has many ideal properties of a surrogate because it can be monitored: (1) in real-time and at high frequency, (2) with sensitivity and accuracy across wide concentration ranges, and (3) by reliable commercial technologies. Paul Westerhoff highlights real-time monitoring as one of the main benefits of TOC as a surrogate: “The nice thing about TOC is that there are online monitors, whereas there are no online monitors for specific chemicals like 1,4-dioxane.”
3) Supplementary Monitoring Frameworks
While TOC is a valuable monitoring tool, TOC monitoring alone is not adequate to achieve the goals of protecting public health, controlling DBP formation, and monitoring process performance. Other monitoring strategies have evolved to complement TOC monitoring.
Complementary Monitoring for Chemical Toxicity
As described in Issue 1 of this series, many potable reuse regulations include extensive monitoring requirements to protect against toxic chemicals. All regulations require monitoring of regulated compounds, and most require at least quarterly monitoring of unregulated trace organic contaminants that may be present in wastewater and pose a public health threat. The direct or “targeted” monitoring of known compounds may be complemented by (1) non-targeted analysis (NTA) to identify unknown compounds via mass spectrometry and/or (2) bioassays to quantify harmful biological effects.
Additional strategies beyond these common monitoring approaches can provide further control of toxic organics. For example, characterizing the organics in the source water can help to inform appropriate TOC limits in a given location. This is the approach employed in Colorado’s DPR regulations. Larry Schimmoller notes the importance of understanding the baseline TOC in source waters because "Once your TOC levels get above the drinking water TOC, the total mass of chemicals of emerging concern (CECs) starts to increase significantly." Maintaining the TOC at or below the drinking water level helps control CEC levels. Other monitoring tools, such as fluorescence excitation-emission matrices (EEMs), can also be used to characterize the organic composition of water. For example, if an EEM shows that a water’s TOC is largely composed of NOM-like organics, the potential toxicity of the water can be better understood. However, Schimmoller adds a note of caution on the complexity of the approach: “I was really excited that we'd be able to use EEMs, but it wasn't that simple when we looked at the data.” Translating the spectra into actionable signals has so far demanded significant effort; however, interviewees expressed hope that artificial intelligence models may help to facilitate the use of EEMs in the future.
Estimating DBP Formation
While NOM is an important precursor to many DBPs, not all TOC in purified waters is NOM and not all NOM reacts equally upon exposure to disinfectants. Additional parameters are needed to better estimate DBP formation. “If you're only going to measure one thing about organic matter, measure UV absorbance (UVA),” recommends Gary Amy. UVA provides insights into the character of the TOC because organics absorb UV light in different ways. The complex organic structures of NOM, including aromatic rings and conjugated bonds, are particularly effective at absorbing UV light. When combined with TOC measurements, UVA can help characterize the types of organic compounds present and their potential to form DBPs.
Another limitation of TOC is that it is a poor indicator of nitrogen-based organic DBPs (e.g., N–nitrosodimethylamine (NDMA)) and inorganic DBPs (e.g., bromate). Organic precursors that lead to nitrogen-based DBPs may be present at ng/L levels that are a minor fraction (<0.01%) of the overall TOC. Bromide, not TOC, is the controlling precursor for inorganic DBPs such as bromate. For a comprehensive estimate of DBP formation, monitoring of additional water quality parameters is needed.
Tracking Treatment Process Performance
Finally, TOC is a powerful indicator of process performance, but only if the treatment process removes TOC. Multiple processes used in potable reuse treatment trains do not remove TOC (e.g., ozone, chlorine, microfiltration). For these processes, other parameters are used to track treatment performance (e.g., disinfectant residual, turbidity).
4) Where Does TOC Leave Us?
Online TOC monitoring remains the most useful tool we currently have to track the presence and fate of bulk organics in advanced water treatment. Reliable commercial technologies allow sensitive, accurate, real-time monitoring across a wide range of concentrations. To make the best use of this tool, TOC limits should be determined with careful consideration of the source-water TOC, the required treatment technologies, and the intended end use of the product water.
While TOC monitoring is valuable, it must be supplemented with other control strategies to ensure that toxic chemicals have been reduced to acceptable levels, to control DBP formation, and to confirm the performance of advanced treatment processes (see Figure 3). Notably, TOC does not provide sufficient sensitivity to protect public health since two purified waters with the same TOC concentration can differ widely in composition and toxicity.

Figure 3: TOC monitoring plays an important role in controlling toxic organics, indicating DBP formation, and tracking process performance, but requires complementary monitoring approaches to protect public health.
Sign up for our email list to receive the Potable Water Reuse Report
The contents of this report are not to be used for advertising, publication, or promotional purposes. Citation of trade names does not constitute an official endorsement or approval of the use of such commercial products by the US Government.
All product names and trademarks cited are the property of their respective owners, the findings of this report are the opinions of the authors only and are not to be constructed as the positions of the US Army Corps of Engineers or the US Government unless so designated by other authorized US Government Documents.